The Solar Power Project
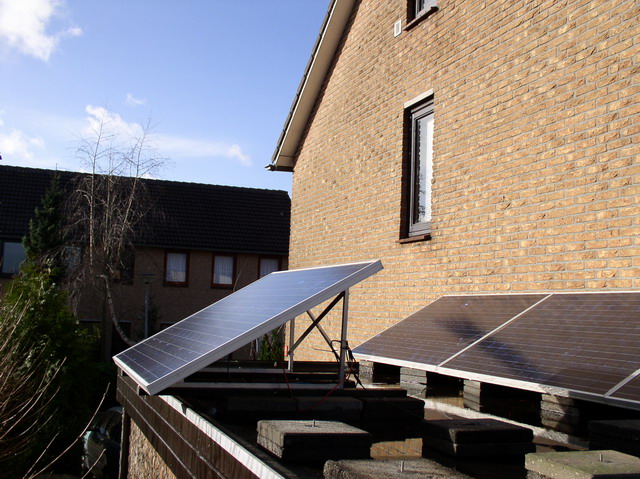
The project started in 2007 with buying and installing a second hand set of Scheuten MultiSol-200 solar panels. Adjacent photograph shows the panels during the installation process on the roof of the garage. The 7 panels, dating from 2003, were 1440 Watt-peak. Technology was simple: just panels and an inverter. No smart electronics, no apps. Having a solar system, the need existed to measure its production. For a software and hardware developer, a production meter wasn't enough, so the Solar Power Project was created to measure and publish production insights on a web site. The website was operational from 2007-2022, until it broke down. In 2025 I moved to a small village. The new house was equiped with 18 solar panels, 5500 Watt-peak. Good reason to kick the project into life once again. Since 31-12-2025 this site has been active for keeping track of the energy usage and production.
History of the webpage and software
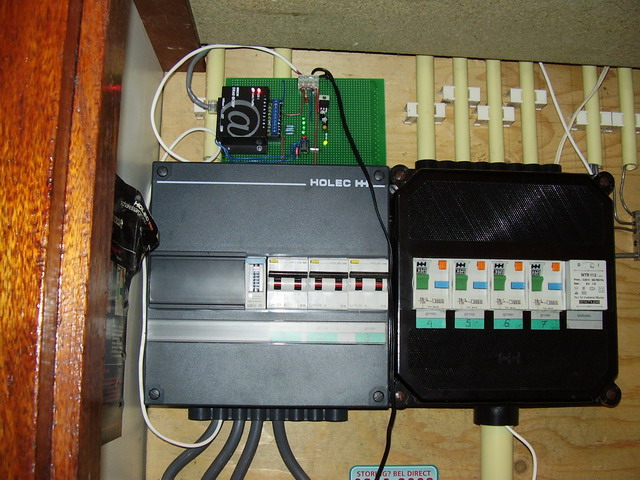
The intial solution consisted of a small system that read out the production pulse meter, based on a DK40 IPC@Chip on a breadboard. I wrote a C program for reading out the pulse meter, send the measurements to my Linux based homeserver for storage in a MySQL database. I created a webpage to show production. It offered a way to register weekly meter readings by hand (every sunday) in order to have a weekly overview of energy usage as well. In this way I could keep track of net and gross usage and the part filled in with solar energy.
Raspberry Pi and Smart Meter
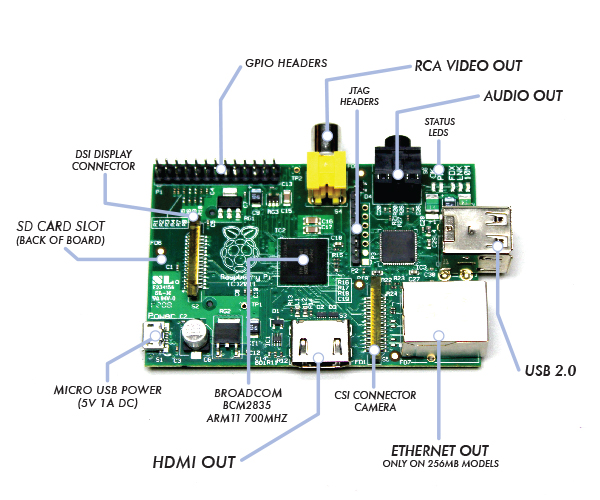
In 2012 I ported the software to the Raspberry Pi, which offered a lot more capabilities than the DK40. Till then, the DK40 has been recording daily yields, from 2012 on the Raspberry Pi started recording five minute measurements as well. Because I received a Microgen MicroCHP (a gas boiler that also generates electricity using a Stirling engine), the software was extended to read-out 3 pulse meters, so it was also capable to read out the μChp production. The software was extended end of 2020 to read out the Dutch Smart Meter, so also net and gross energy usage could be monitored at 5 minutes interval. Publishing real-time measurements by websockets and AMQP messaging (every 2 seconds) was added. The system monitored the first solar system from 2007 till 2022.
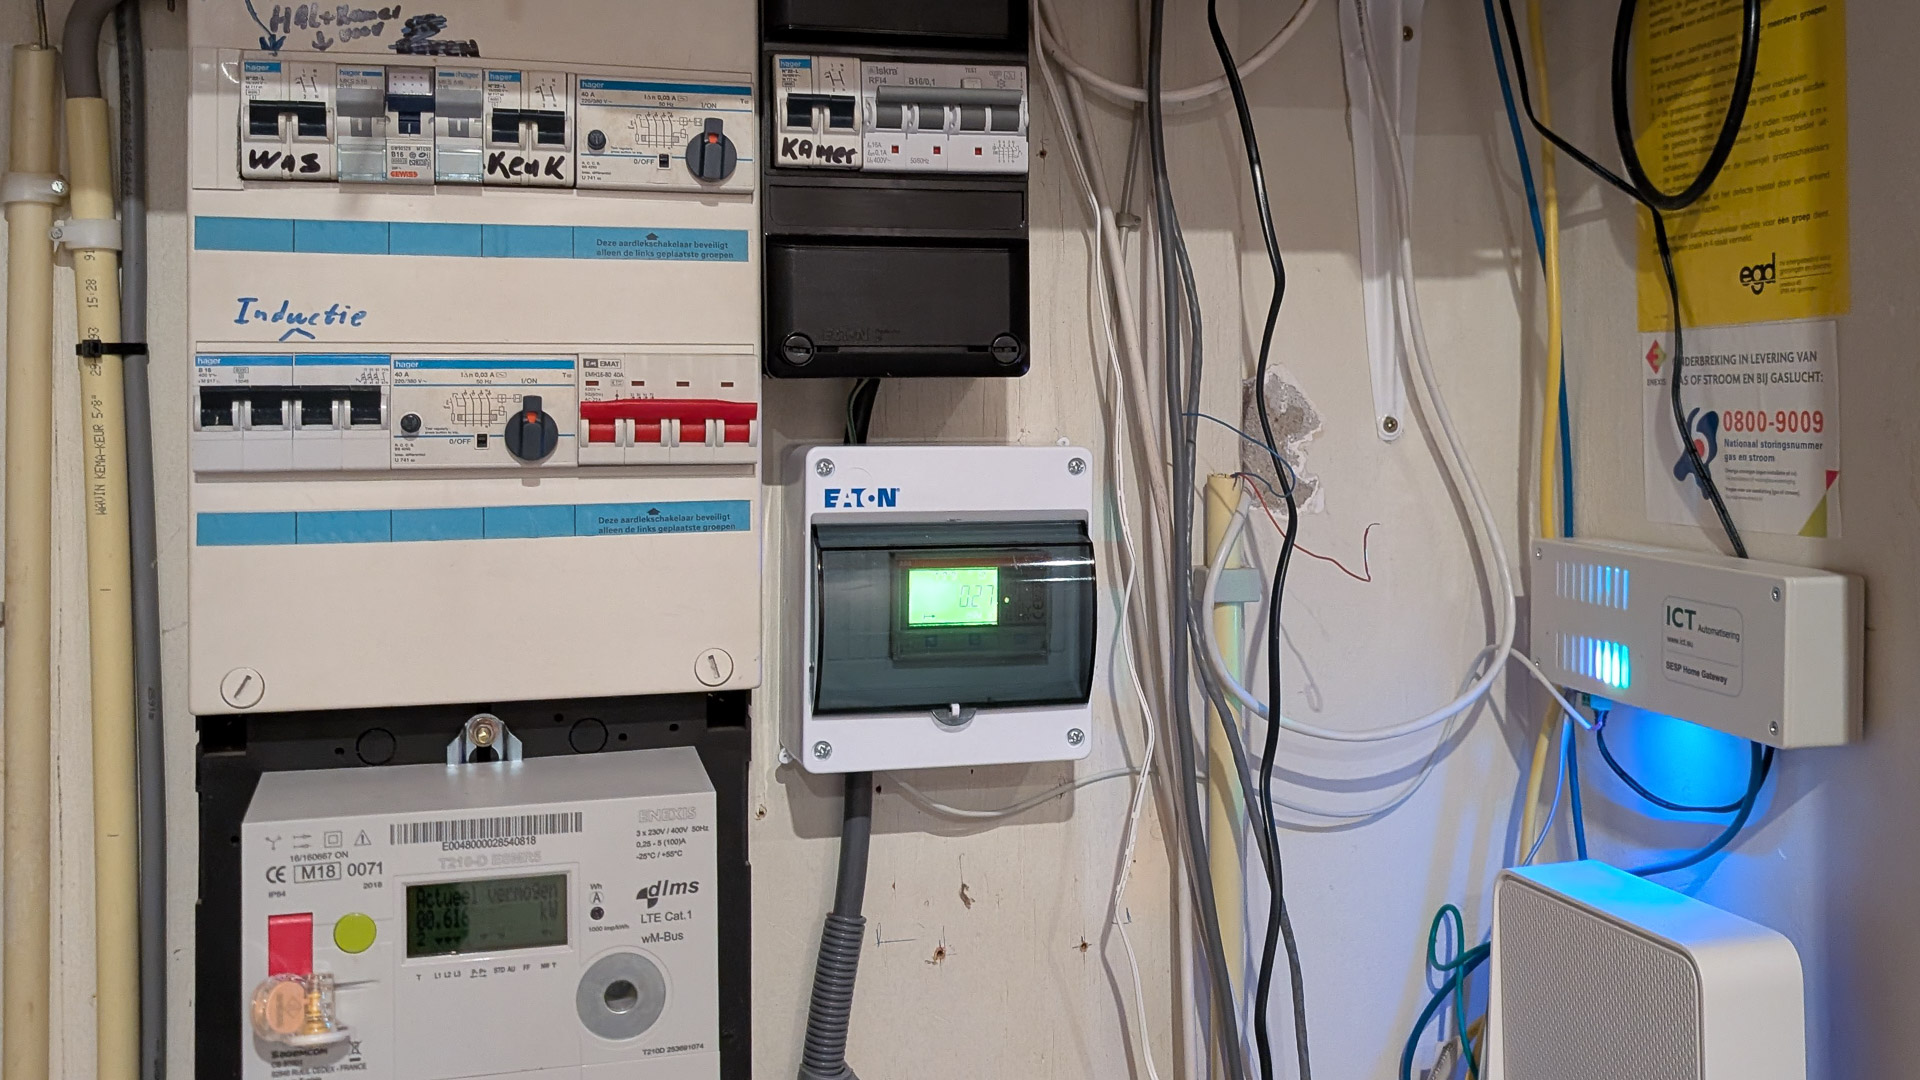
Since 2026 it monitors the 2nd solar system using this site. Modern PV systems generate PV electricity, but in the dark they use energy. Therefore a pulse meter is needed that only generates pulses when power flows in one direction, like the ABB B23. Since 2026 the source code is available on Github, after a thorough refurbisment to version 6.2. It now supports the DSMR5.0 Dutch Smart Meter which also measures power quality. Voltages, currents, active power, sags and swells per phase and power failures are stored every 5 minutes.